Introduction
LinearB, a leading provider of DevOps analytics and productivity solutions, is set to revolutionize the industry with the upcoming release of its free DORA Metrics dashboard. With over a decade of experience in the field of DevOps, LinearB has consistently pushed the boundaries of what’s possible, and this new offering promises to be a game-changer. In this article, we’ll delve into the significance of this release, explore its key features, and discuss how it can empower development and operations teams to enhance their software delivery processes.
The Evolution of DevOps Metrics
DevOps has come a long way since its inception, and one of the critical aspects of its evolution has been the development and utilization of metrics to measure and improve performance. The DORA (DevOps Research and Assessment) metrics, popularized by the book “Accelerate” by Nicole Forsgren, Jez Humble, and Gene Kim, have become a standard for assessing DevOps success. These metrics, including Deployment Frequency, Lead Time for Changes, Change Failure Rate, and Time to Restore Service, have proven to be valuable indicators of an organization’s DevOps maturity.
The Role of DORA Metrics
DORA metrics provide organizations with insights into their software delivery processes. They help identify bottlenecks, inefficiencies, and areas for improvement. By tracking these metrics, teams can make data-driven decisions to optimize their DevOps practices, resulting in faster and more reliable software delivery.
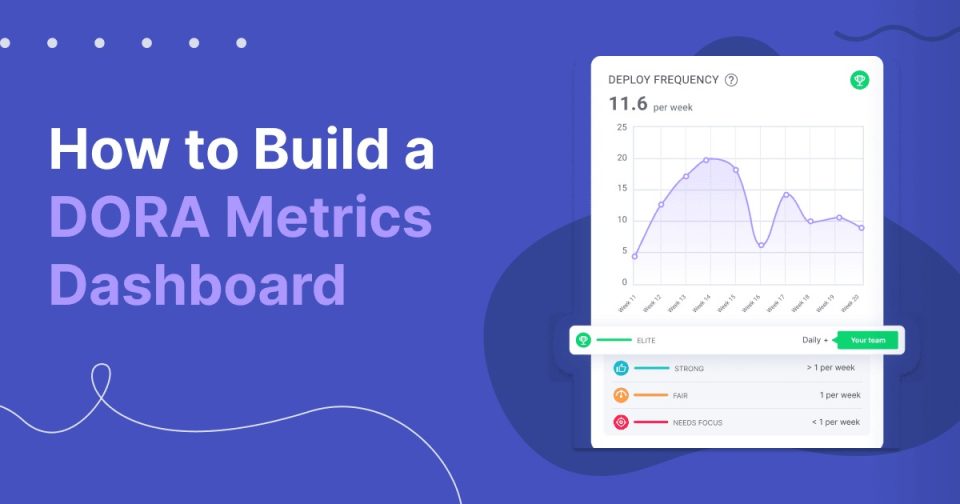
LinearB’s Free DORA Metrics Dashboard
LinearB’s decision to release a free DORA Metrics dashboard is a significant development for the DevOps community. Here are some key highlights of what this dashboard has to offer:
Real-time Data Visualization
The dashboard provides real-time visualizations of DORA metrics, giving teams instant visibility into their performance. This capability is crucial for making on-the-fly adjustments and ensuring that DevOps goals are being met.
Historical Trend Analysis
Understanding how your metrics have evolved over time is essential for continuous improvement. LinearB’s dashboard includes historical trend analysis, enabling teams to track progress and identify long-term trends that impact software delivery.
Benchmarking and Comparison
LinearB’s extensive industry experience has allowed them to incorporate benchmarking capabilities into the dashboard. Teams can compare their performance against industry standards, helping them set realistic goals and expectations.
Actionable Insights
The dashboard goes beyond mere data presentation by providing actionable insights. It not only highlights areas where improvement is needed but also offers recommendations on how to address specific issues.
How LinearB’s Dashboard Empowers Teams
LinearB’s free DORA Metrics dashboard empowers development and operations teams in several ways:
Enhanced Collaboration
By providing a centralized platform for tracking DORA metrics, the dashboard encourages collaboration between development and operations teams. It fosters a shared understanding of goals and helps teams work together to achieve them.
Continuous Improvement
The real-time data and historical trend analysis enable teams to identify areas for improvement quickly. This empowers them to make data-driven decisions and implement changes to enhance their software delivery processes continually.
Data-Driven Decision-Making
With actionable insights and benchmarking capabilities, the dashboard equips teams with the information needed to make informed decisions. This reduces guesswork and promotes a culture of data-driven decision-making.
Cost Savings
Improving software delivery processes not only results in faster time-to-market but also reduces the risk of costly failures. LinearB’s dashboard helps teams identify and mitigate issues early, ultimately saving time and resources.
Conclusion
In conclusion, LinearB’s upcoming release of a free DORA Metrics dashboard is a significant step forward in the world of DevOps analytics. By providing real-time data visualization, historical trend analysis, benchmarking, and actionable insights, this dashboard empowers development and operations teams to optimize their software delivery processes effectively. With a decade of experience in the DevOps field, LinearB has once again demonstrated its commitment to advancing the industry. Stay tuned for the release, as it promises to be a valuable addition to any organization’s DevOps toolkit. Embrace the power of data-driven DevOps, and accelerate your software delivery with LinearB’s DORA Metrics dashboard.